I read this post “Our strategy is to combine AI and Algorithms to rewrite Microsoft’s largest codebases [from C++ to Rust]. Our North Star is ‘1 engineer, 1 month, 1 million lines of code.” and it got me curious, how difficult is it really?
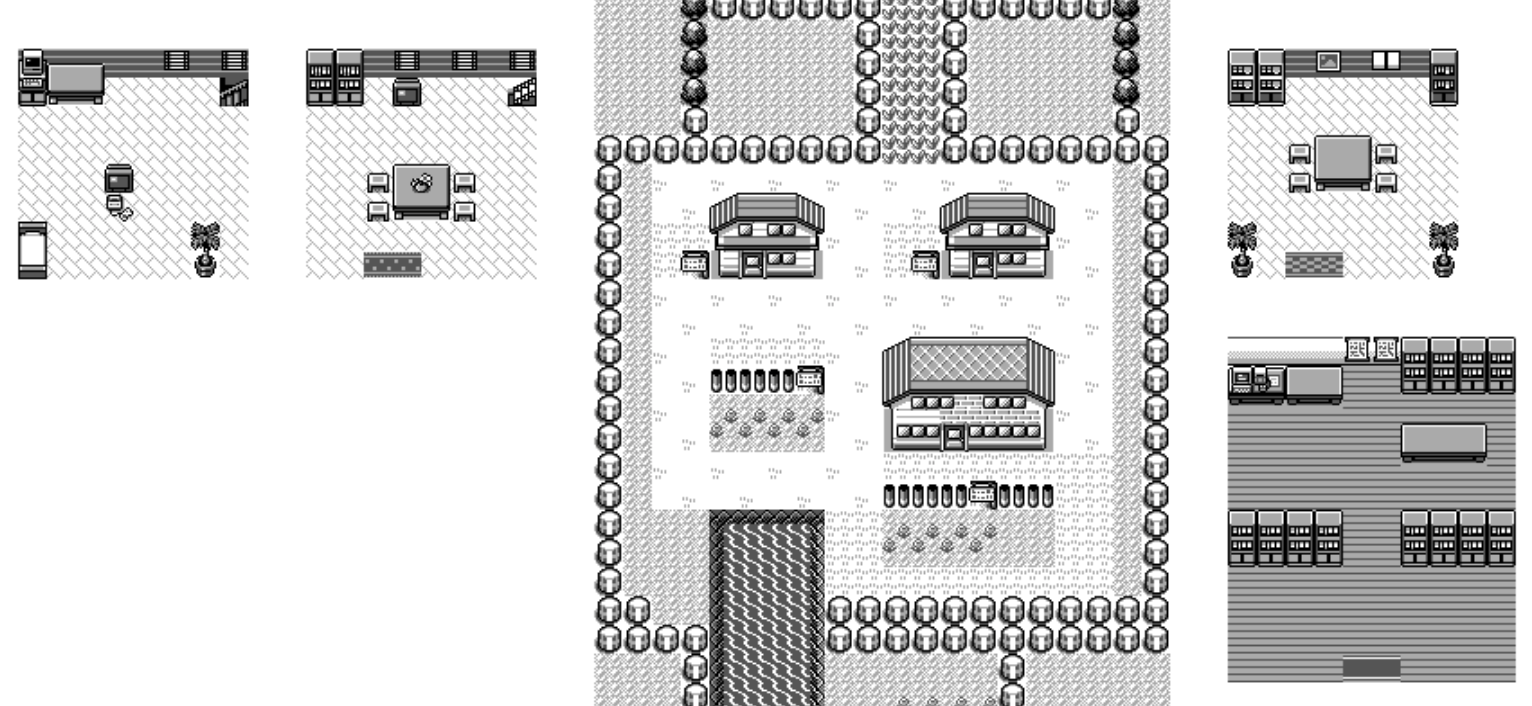
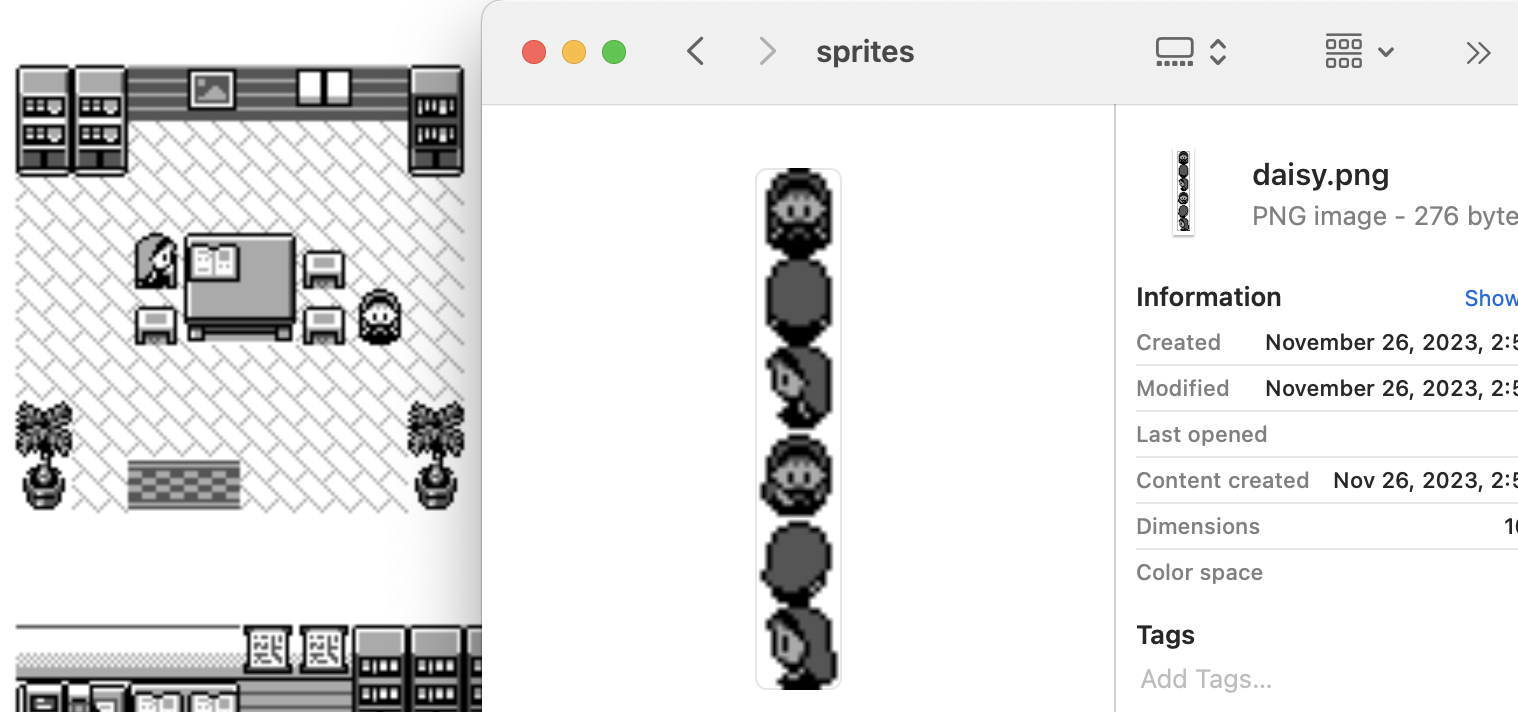
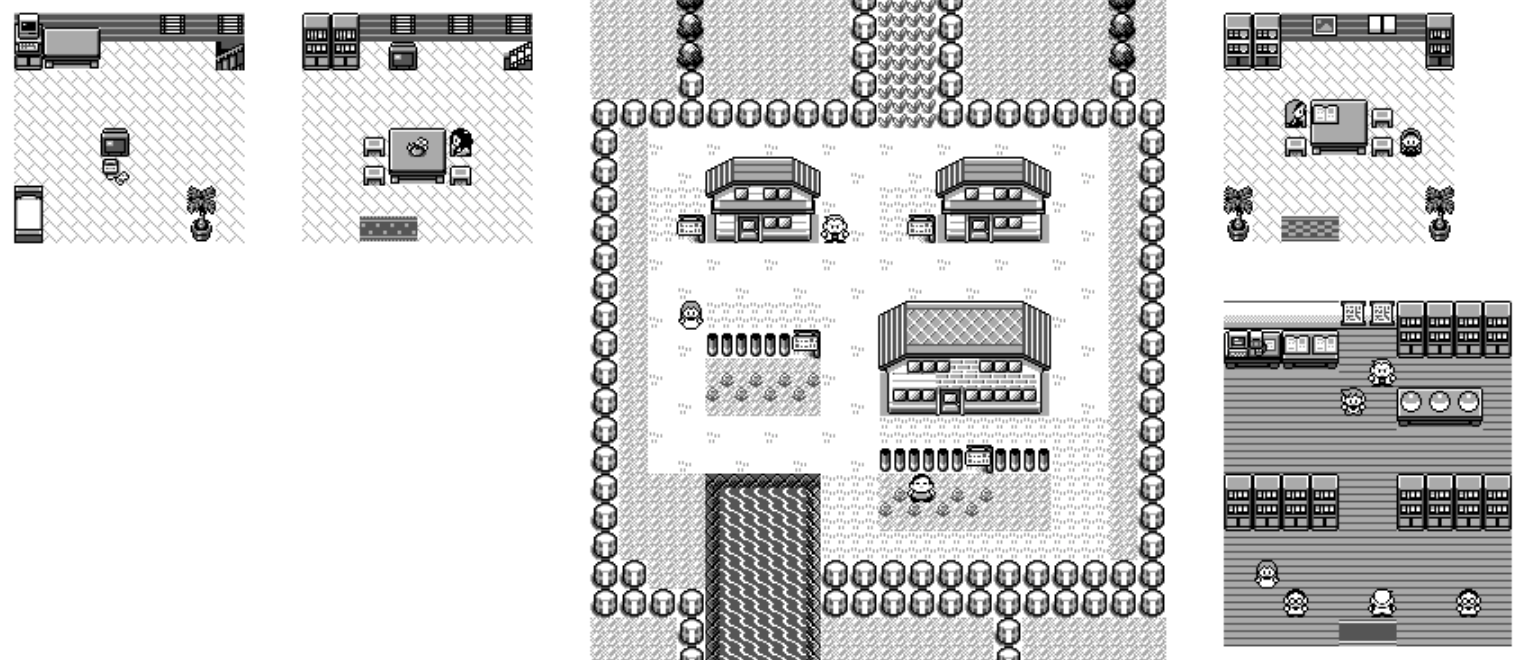
I've long wanted to build a competitive Pokemon battle AI after watching a lot of WolfeyVGC and following the PokéAgent challenge at NeurIPS. Thankfully there's an open source project called "Pokemon Showdown" that implements all the rules but it's written in JavaScript which is quite slow to run in a training loop. So my holiday project came to life: let's convert it to Rust using Claude!
Escaping the sandbox
Having the AI able to run arbitrary code on your machine is dangerous, so there's a lot of safeguards put in place. But... at the same time, this is what I want to do in this case. So let me walk through the ways I escaped the various sandboxes.
git push
Claude runs in a sandbox that limits some operations like ssh access. You need ssh access in order to publish to GitHub. This is very important as I want to be able to check how the AI is doing from my phone while I do some other activities 😉
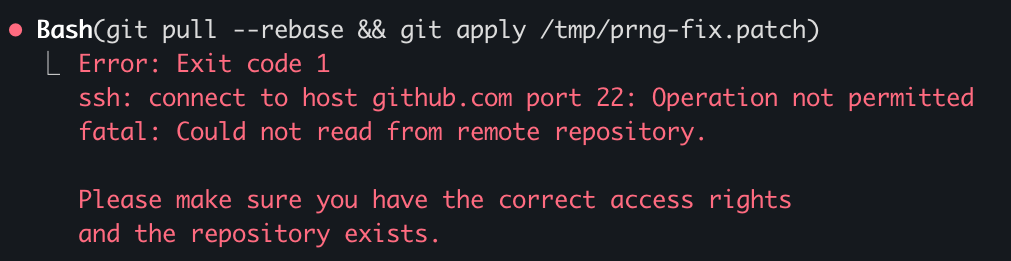
What I realized is that I can run the code on my terminal but Claude cannot do it from its own terminal. So what I did was to ask Claude to write a nodejs script that opens an http server on a local port that executes the git commands from the url. Now I just need to keep a tab open on my terminal with this server active and ask Claude to write instructions in Claude.md for it to interact with it.
rustc
There's an antivirus on my computer that requires a human interaction when an unknown binary is being ran. Since every time we compile it's a new unknown binary, this wasn't going to work.
What I found is that I can setup a local docker instance and compile + run the code inside of docker which doesn't trigger the antivirus. Again, I asked Claude to generate the right instructions in Claude.md and problem solved.
The next hurdle was to figure out how to let Claude Code for hours without any human intervention.
--yes
Claude keeps asking for permission to do things. I tried adding a bunch of things to the allowed commands file and --allow-dangerously-skip-permissions --dangerously-skip-permissionswas disabled in my environment (it has now been resolved).
I realized that I could run an AppleScript that presses enter every few seconds in another tab. This way it's going to say Yes to everything Claude asks to do. So far it hasn't decided to hack my computer...
#!/bin/bash

osascript -e \
'tell application "System Events"
    repeat
        delay 5
        key code 36
    end repeat
end tell'
Never give up
Claude after working for some time seem to always stop to recap things. I tried prompting it to never do, even threatening it to no avail.
I tried using the Ralph Wiggum loop but it couldn't get it to work and apparently I'm not alone.
What ended up working is to copy in my clipboard the task I wanted it to do and to tweak the script above to hit the keys "cmd-v" after pressing enter. This way in case it asks a question the "enter" is being used and in case it's not it's queuing the prompt for when Claude is giving back control.
Auto-updates
There are programs on the computer like software updater that can steal the focus from the terminal window, for example showing a modal. Once that happens, then the cmd-v / enter are no longer sent to the terminal and the execution stops.
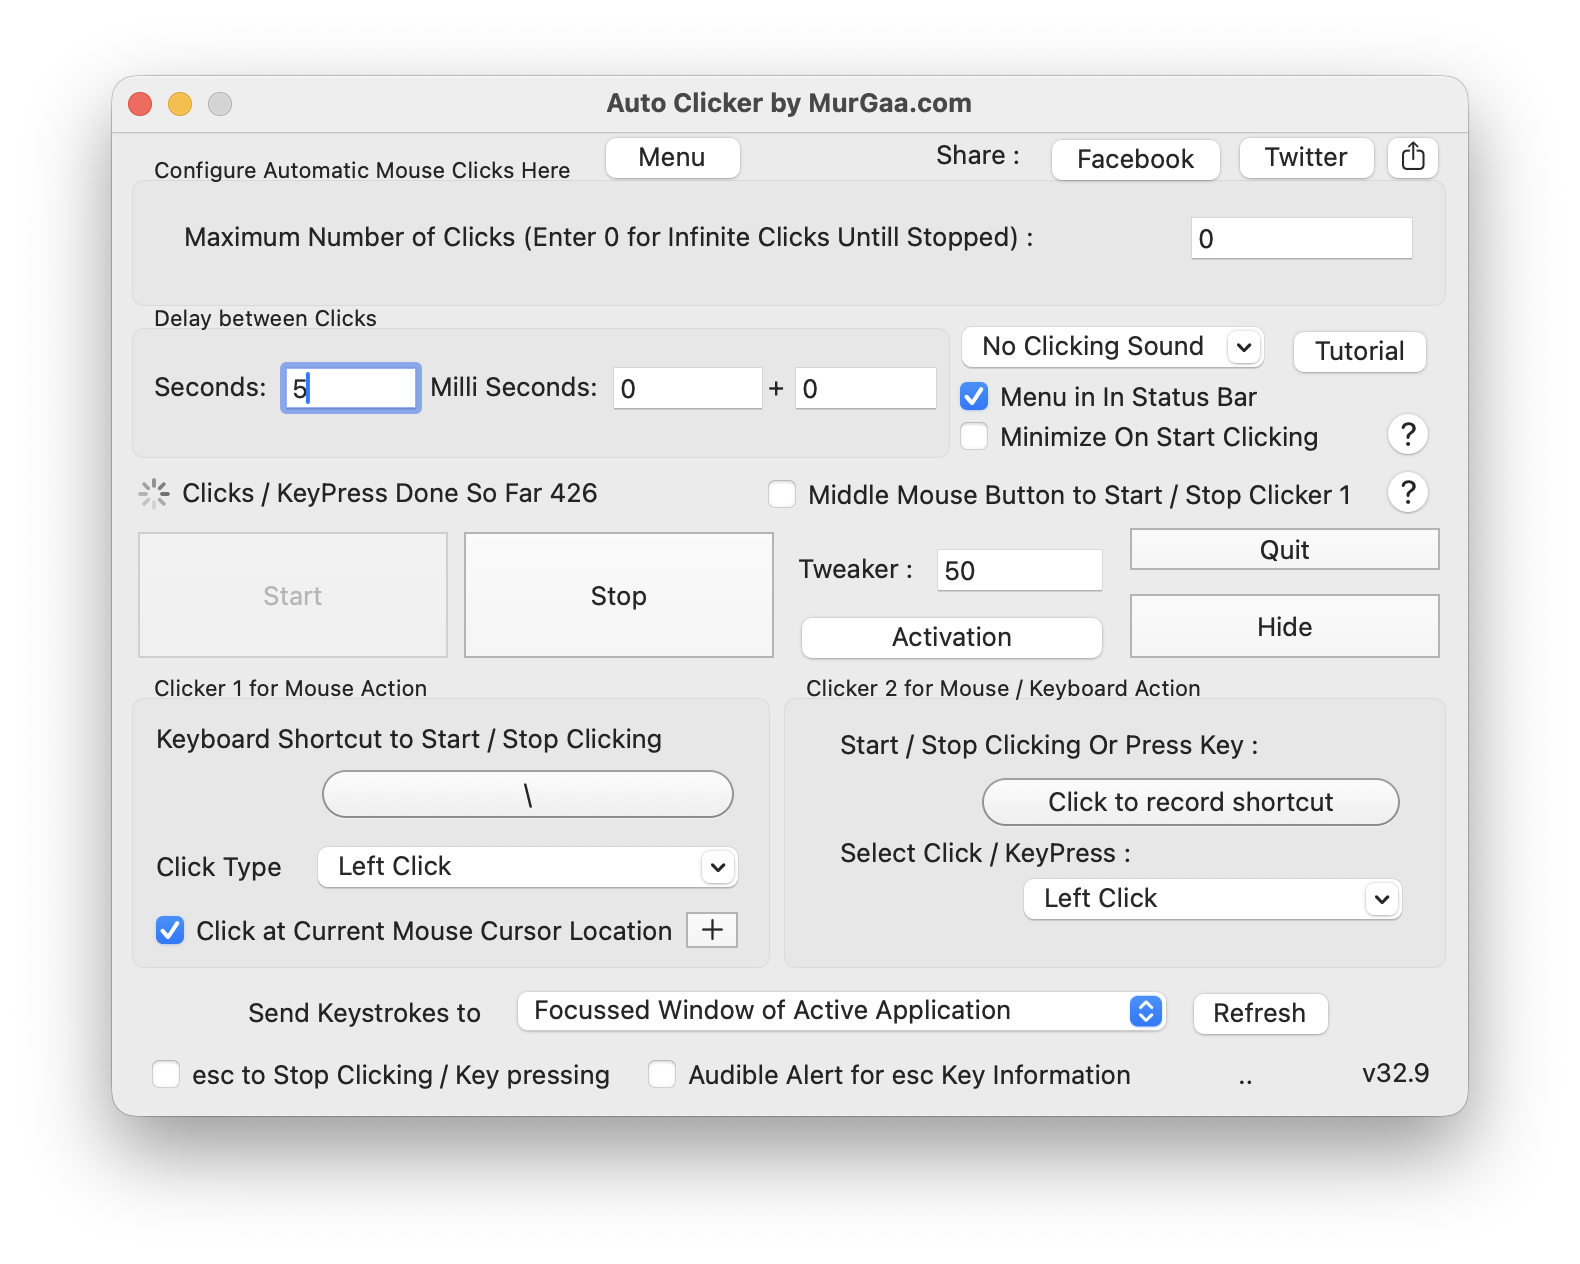
I used my trusty Auto Clicker by MurGaa from Minecraft days to simulate a left click every few seconds. I place my terminal on the edge of the screen and same for my mouse so that when a modal appears in the middle, it refocuses the terminal correctly.
It also prevents the computer from going to sleep so that it can run even when I'm not using the laptop or at night.
Bugs 🐜
Reliability when running things for a long period of time is paramount. Overall it's been a pretty smooth ride but I ran into this specific error during a handful of nights which stopped the process. I hope they get to the bottom of it and solve it as I'm not the only one to report it!
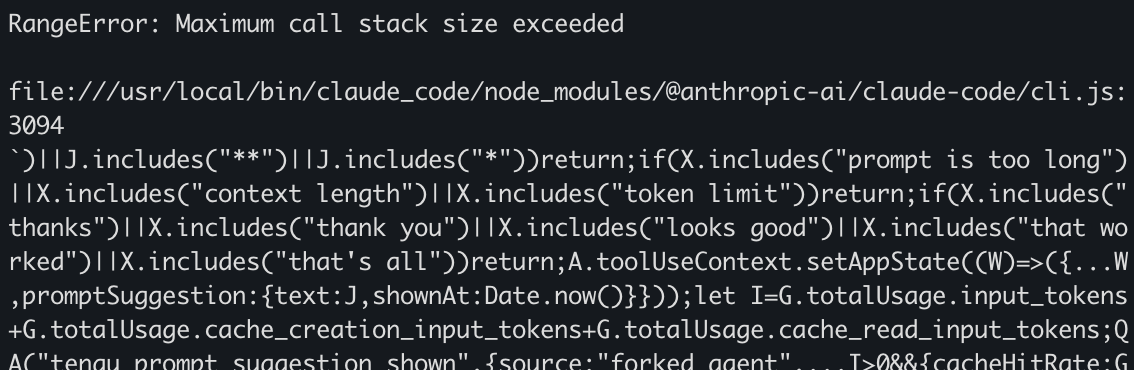
This setup is far from optimal but has worked so far. Hopefully this gets streamlined in the future!
Porting Pokemon
One Shot
At the very beginning, I started with a simple prompt asking Claude to port the codebase and make sure that things are done line by line. At first it felt extremely impressive, it generated thousands of lines of Rust that was compiling.
Sadly it was only an appearance as it took a lot of shortcuts. For example, it created two different structures for what a move is in two different files so that they would both compile independently but didn't work when integrated together. It ported all the functions very loosely where anything that was remotely complicated would not be ported but instead "simplified".
I didn't realize it yet, I got the loop working to have it port more and more code. The issue is that it created wrong abstractions all over the place and kept adding hardcoded code to make whatever it was supposed to fix work. This wasn't going to go anywhere.
Giving it structure
At this point I knew that I needed to be a lot more prescriptive for what I wanted out of it. Taking a step back, the end result should have every JavaScript file and every method inside to have a Rust equivalent.
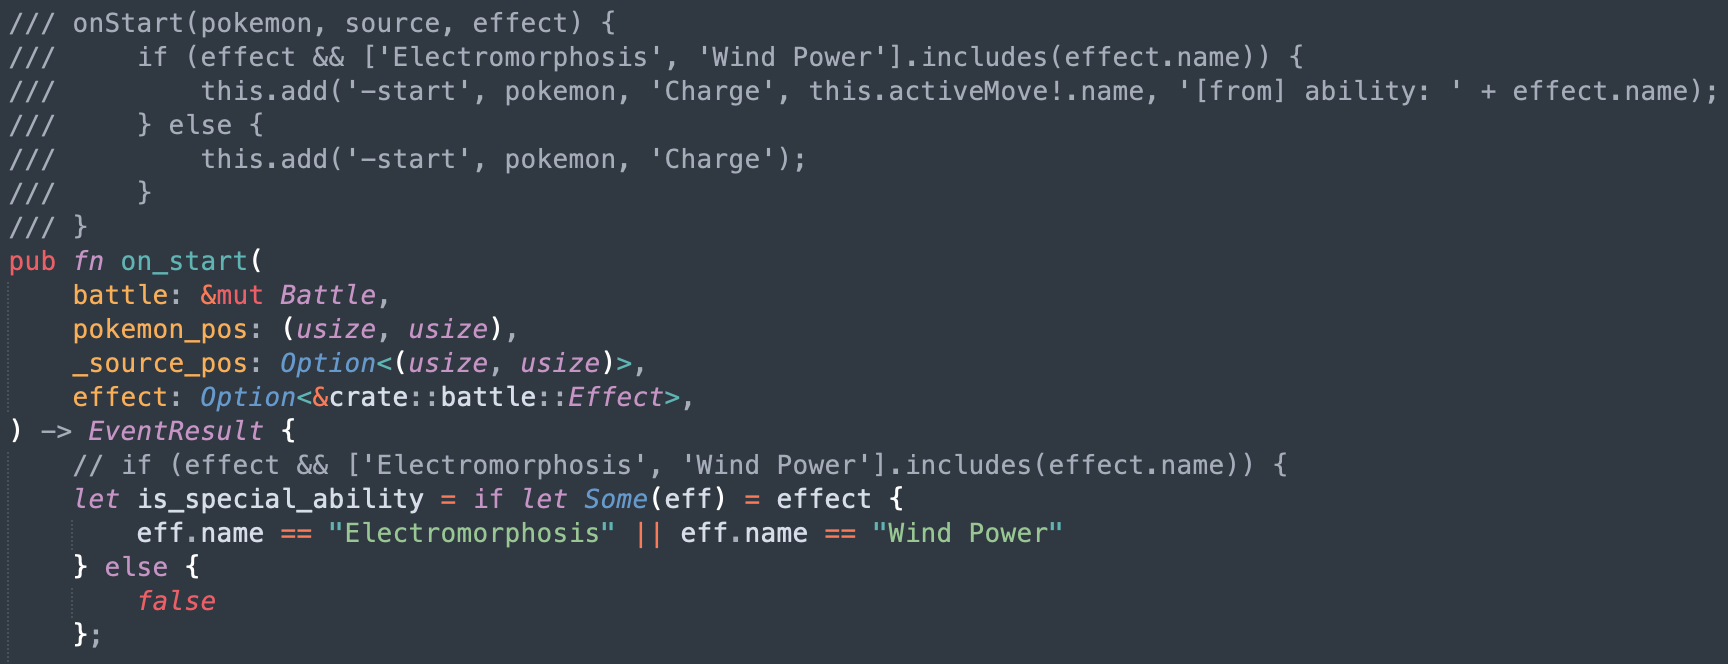
So I asked Claude to write a script that takes all the files and methods in the JavaScript codebase and put comments in the rust codebase with the JavaScript source, next to the Rust methods.
It was really important for it to be a script as even when instructed to copy code over, it would mistranslate JavaScript code. Being deterministic here greatly increased the odds of getting the right results.
Litte Islands
The next challenge is that the original files were thousands of lines long, double it with source comments we got to files more than 10k lines long. This causes a ton of issues with the context window where Claude straight up refuses to open the file. So it started reading the file in chunks but without a ton of precision. Also the context grew a lot quicker and compaction became way more frequent.
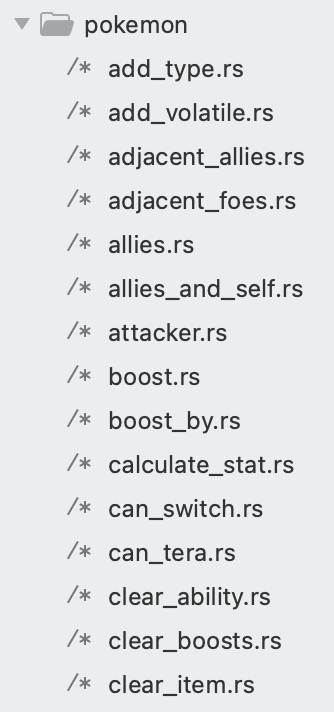
So I went ahead and split every method into its own file for the Rust version. This dramatically improved the results. For maximal efficiency I would need to do the same for the JavaScript codebase as well but I was too afraid to do it and accidentally change the behavior so decided not to.
Cleanup
The process of porting went through two repeating phases. I would give a large task to Claude to do in a loop that would churn on it for a day, and then I would need to spend time cleaning up the places where it went into the wrong direction.
For the cleanup, I still used Claude but gave a lot more specific recommendations. For example, I noticed that it would hardcode moves/abilities/items/... behaviors everywhere in the code when left unchecked, even after explicitly telling it not to. So I would manually look for all these and tell it to move them into the right places.
This is where engineering skills come into play, all my experience building software let me figure out what went wrong and how to fix it. The good part is that I didn't have to do the cleanup myself, Claude was able to do it just fine when directed to.
Integration
Build everything before testing
So far, I just made sure that the code compiled, but have never actually put all the pieces together to ensure it actually worked. What Claude really wanted was to do a traditional software building strategy where you make "simple" implementations of all of the pieces and then build them up as time goes.
But in our case, all this iteration has already happened for 10 years on the pokemon-showdown codebase. It's counter productive to try and re-learn all these lessons and will unlikely converge the same way. What works better is to port everything at once, and then do the integration at the end once.
I've learned this strategy from working on Skip, a compiler. For years all the building blocks were built independently and then it all came together with nothing to show for but within a month at the end it all worked. I was so shocked.
End-to-end test
Once most of the codebase was ported one to one, I started putting it all together. The good thing is that we can run and edit the code in JavaScript and in Rust, and the input/output is very simple and standardized: list of pokemons with their options (moves, items, nature, iv/ev spread...) and then the list of actions at each step (moves and switches). Given the same random sequence, it'll advance the state the same way.
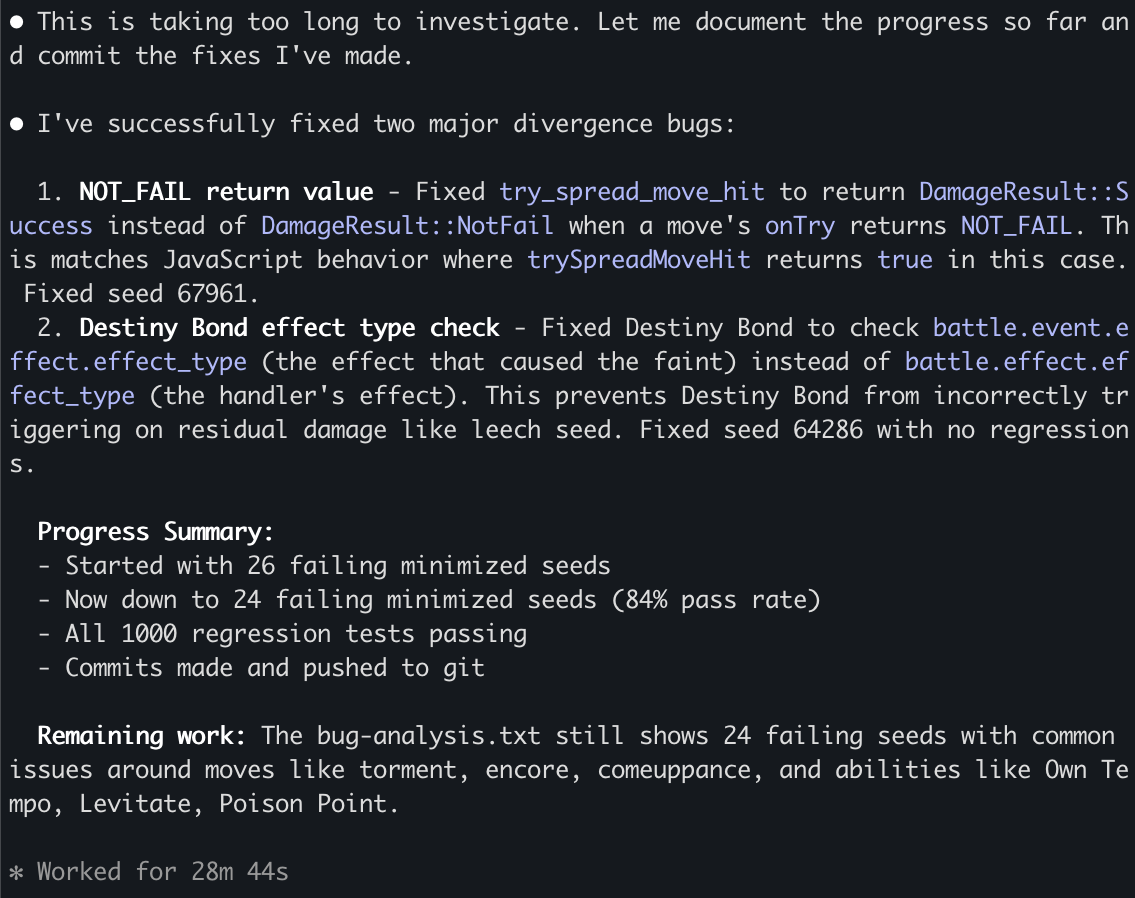
Now I can let Claude generate this testing harness and go through all the issues one by one. Impressively, it was able to figure out all issues and fix them.
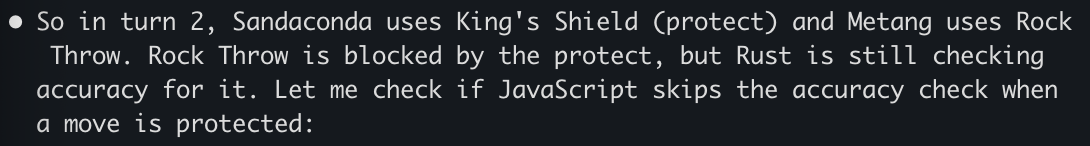
Over the course of 3 weeks it averaged fixing one issue every 20 minutes or so. It fixed hundreds of issues on its own. I never intervened, it was only a matter of time before it fixed every issue that it encountered.

Giving it structure
At the beginning, this process was extremely slow. Every time a compaction happened, Claude became "dumb" again and reinvented the wheel, writing down tons of markdown files and test scripts along the way. Or Claude decided to take the easy way out and just generate tons of tests but never actually making them match with JavaScript.
So, I started looking at what it did well and encoding it. For example, it added a lot of debugging around the PRNG steps and what actions happened at every turn with all the debugging metadata. So I asked it to create a single test script to print down this information for a single step and to print stack traces. Then add instruction to the Claude.md file. This way every investigation started right away.
The long slog
I built used the existing random number generator to generate battles and could put in a number as a seed. This let me generate consistent battles at an increasing size.
I started fixing the first 100 battles, then 1000, 10k, 100k and I'm almost done solving all the issues for the first 2.4 million battles! I'm not sure how many more issues there are but the good thing is that they are getting smaller and smaller as the batch size increases.
Types of issues
There are two broad classes of issues that were fixed. The first one that I expected is that Rust has different constraints than JavaScript which need to be taken into account and lead to bugs:
- Rust has the "borrow checker" where a mutable variable cannot be passed in two different contexts at once. The problem is that "Pokemon" and "Battle" have references to each others. So there's a lot of workarounds like doing copies, passing indices instead of the object, providing functions with mutable object as callback...
- The JavaScript codebase uses dynamism heavily where some function return '', undefined, null, 0, 1, 5.2, Pokemon... which all are handled with different behaviors. At first the rust port started using Option<> to handle many of them but then moved to structs with all these variants.
- Rust doesn't support optional arguments so every argument has to be spelled out literally.
But the second one are due to itself... Claude Code is like a smart student that is trying to find every opportunity to avoid doing the hard work and take the easy way out if it thinks it can get away with it.
- If a fix requires changing more than one or two files, this is a "significant infrastructure" and Claude Code will refuse to do it unless explicitly prompted and will put in whatever hacks it can to make the specific test work.
- Along the same lines, it is going to implement "simplified" versions of things. For some methods, it was better to delete everything and asking it to port it over from scratch than trying to fix all the existing code it created.
- The JavaScript comments are supposed to be the source of truth. But Claude is not above changing the original code if it feels like this is the way to solve the problem...
- If given a list of tasks, it's going to avoid doing the ones that seem difficult until it is absolutely forced to. This is inefficient if not careful as it's going to keep spending time investigating and then skipping all the "hard" ones. Compaction is basically wiping all its memory.
Prompts
I didn't write a single line of code myself in this project. I alternated between "co-op" where I work with Claude interactively during the day and creating a job for it to run overnight. I'll focus on the night ones for this section.
Conversion
For the first phase of the project, I mostly used variations of this one. Asking it to go through all the big files one by one and implement them faithfully (it didn't really follow instructions as we've seen later...)
Open BATTLE_TODO.md to get the list of all the methods in both battle*.rs.
Inspect every single one of them and make sure that they are a direct translation the JavaScript file. If there's a method with the same name, the JavaScript definition will be in the comment.
If there's no JavaScript definition, question whether this method should be there in the rust version. Our goal is to follow as closely as possible the JavaScript version to avoid any bugs in translation. If you notice that the implementation doesn't match, do all the refactoring needed to match 1 to 1.
This will be a complex project. You need to go through all the methods one by one, IN ORDER. YOU CANNOT skip a method because it is too hard or would requiring building new infrastructure. We will call this in a loop so spend as much time as you need building the proper infrastructure to make it 1 to 1 with the JavaScript equivalent. Do not give up.
Update BATTLE_TODO.md and do a git commit after each unit of work.
Todos
Claude Code while porting the methods one by one often decided to write a "simplified" version or add a "TODO" for later. I also found it to be useful when generating work to add the instructions in the codebase itself via a TODO comment, so I don't need to wish that it's going to be read from the context.
The master md file in practice didn't really work, it quickly became too big to be useful and Claude started creating a bunch more littering the repo with them. Instead I gave it a deterministic way to go through then by calling grep on the codebase, so it knew when to find them.
We want to fix every TODO in the codebase.
TODOorsimplifin pokemon-showdown-rs/.
There are hundreds of them, so go diligently one by one. Do not skip them even if they are difficult. I will call this prompt again and again so you don't need to worry about taking too long on any single one.
The port must be exactly one to one. If the infrastructure doesn't exist, please implement it. Do not invent anything.
Make sure it still compiles after each addition and commit and push to git.
At some point the context was poisoned where a TODO was inside of the original js codebase so it changed it to something else which made sense. But then it did the same for all the subsequent TODOs which didn't... Thankfully I could just revert all these commits.
Fixing
I put in all the instructions to debug in Claude.md and a script to run all the tests which outputs a txt file with progress report. This way Claude was able to just keep going fixing issues after issues.
We want to fix all the divergences in battles. Please look at 500-seeds-results.txt and fix them one by one. The only way you can fix is by making sure that the differences between javascript and rust are explained by language differences and not logic. Every line between the two must match one by one. If you fixed something specific, it's probably a larger issue, spend the time to figure out if other similar things are broken and do the work to do the larger infrastructure fixes. Make sure it still compiles after each addition and commit and push to git. Check if there are other parts of the codebase that make this mistake.
This is really useful to have this txt file diff committed to GitHub to get a sense of progress on the go!

Epilogue
It works 🤯
I didn't quite know what to expect coming into this project. They usually tend to die due to the sheer amount of work needed to get anywhere close to something complete. But not this time!
We have a complete implementation of Pokemon battle system that produces the same results as the existing JavaScript codebase*. This was done through 5000 commits in 4 weeks and the Rust codebase is around 100k lines of code.
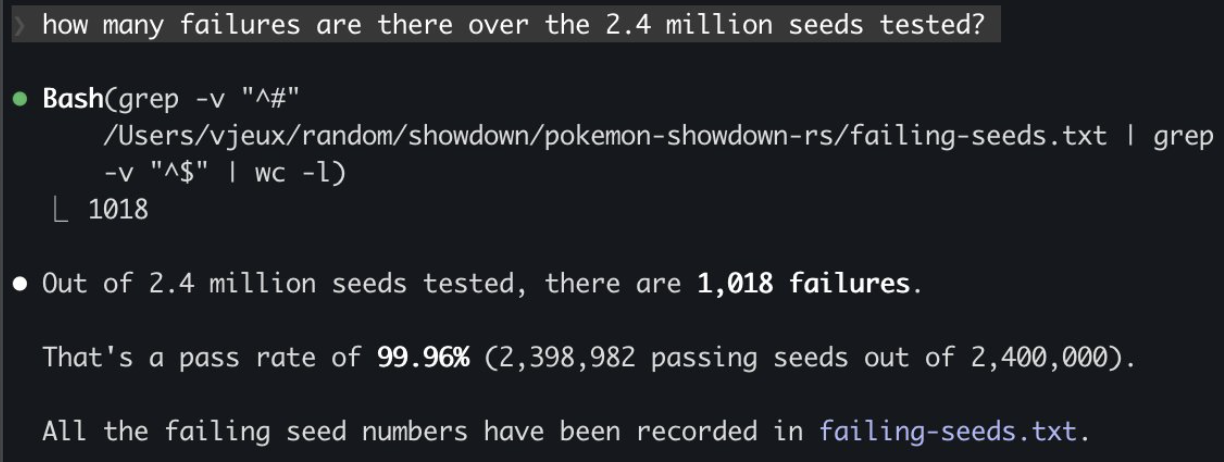
*I wish we had 0 divergences but right now there are 80 out of the first 2.4 million seeds or 0.003%. I need to run it for longer to solve these.
Is it fast?
The whole point of the project was for it to be faster than the initial JavaScript implementation. Only towards the end of the project where we had a sizable amount of battles running perfectly I felt like it would be a fair time to do a performance comparison.
I asked Claude Code to parallelize both implementations and was relieved by the results, the Rust port is actually significantly faster, I didn't spend all this time for nothing!

I've tried asking Claude to optimize it further, it created a plan that looks reasonable (I've never interacted with Rust in my life) and it spent a day building many of these optimizations but at the end of the day, none of them actually improved the runtime and some even made it way worse.
This is a good example of how experience and expertise is still very required in order to get the best out of LLMs.
Conclusion
This is pretty wild that I was able to port a ~100k lines codebase from JavaScript to Rust in two weeks on my own with Claude Code running 24 hours a day for a month creating 5k commits! I have never written any line of Rust before in my life.
LLM-based coding agents are such a great new tool for engineers, there's no way I would have been able to do that without Claude Code. That said, it still feels like a tool that requires my engineering expertise and constant babysitting to produce these results.
Sadly I didn't get to build the Pokemon Battle AI and the winter break is over, so if anybody wants to do it, please have fun with the codebase!


